How can you make sure your app is operating at its best? By using the Visual Studio Profiler, you can be confident that your Universal Windows Platform app is always performing at the optimum level.
Visual Studio Profiling Tools let developers measure, evaluate, and target performance-related issues in their code. These tools are fully integrated into the IDE to provide a seamless and approachable user experience. Users also have the flexibility of accessing Profiling Tools from the command-line, allowing developers the ability to automate tasks that use script.
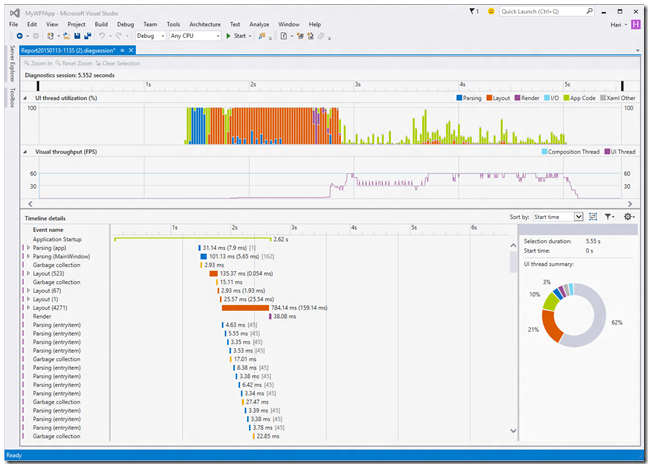
The profiler gives you practical information about the performance of your UWP app, and includes five tools:
Visual Studio Profiling Tools let developers measure, evaluate, and target performance-related issues in their code. These tools are fully integrated into the IDE to provide a seamless and approachable user experience. Users also have the flexibility of accessing Profiling Tools from the command-line, allowing developers the ability to automate tasks that use script.
The profiler gives you practical information about the performance of your UWP app, and includes five tools:
- Application Timeline, to see where time is spent in your app
- CPU Usage, to see where the CPU is spending time executing your code
- GPU Usage, to determine whether the CPU or GPU is the performance bottleneck
- Memory Usage, to investigate app memory to find issues such as memory leaks
- Network, to gather information about each network operation in your app, including HTTP request and response headers, payloads, cookies, timing data and more
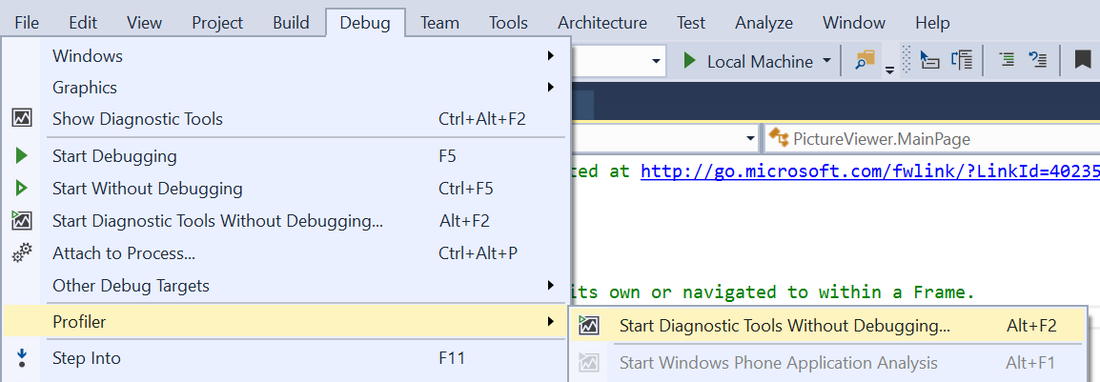
Please follow the steps below:
- Run Visual Studio
- To use the Profiler, go to Debug > Profiler > Start Diagnostic Tools Without Debugging… or simply hit Alt+F2 to get started!
You can learn more ways to use the Visual Studio Profiler in this new Windows 10X10 post in the Building Apps for Windows blog, Optimizing your XAML app for performance.

